CORE REPORTING AND ANALYTICS
Start making confident, data-driven decisions.
Ready to scale and adapt to the new work day? Join 20 million monthly active users on Workday unlocking real-time workforce insights, improving decision-making, and enhancing agility.
WHAT YOU CAN DO
Uncover insights at the speed of business demands.
Workday Human Capital Management and Workday Financial Management systems include a powerful analytics and reporting toolkit that makes it easy to perform analysis in the same system where you make decisions and plans. That’s adaptable technology.
-
Reporting using real-time data
-
Drag-and-drop ad hoc analysis
-
5,025+ prebuilt configurable reports
-
160+ prebuilt configurable dashboards
-
Scalable self-service
-
Flexible role-based security
-
Centralized Analytics and Reporting Hub
Real-time analytics in the flow of work.
Smooth operations start with reliable data. Create and share insights in the context of business processes, employee profiles, and custom applications across the Workday platform.
Build reliable, detailed reports.
Create a data-driven foundation for your business and your people with over 5,000 prebuilt, configurable reports that deliver insights to the right people at the right time.
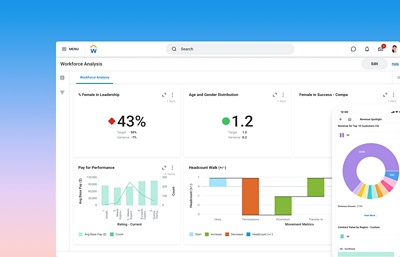
See key metrics at a glance.
Make it easy for your people to monitor performance, KPIs, and topics of interest with over 160 prebuilt, configurable dashboards.
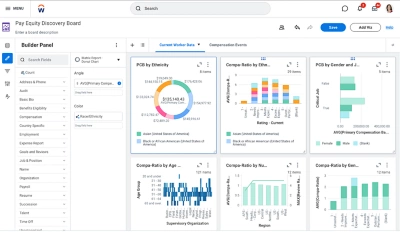
Perform ad hoc analysis with discovery boards.
Quickly build dynamic visualizations with the intuitive drag-and-drop design of discovery boards—no coding or technical knowledge required.
Create dynamic data visualizations.
Amplify key details using an array of visualization types with discovery boards in Workday. Create custom color palettes, descriptions, and custom drill-down views, and even curate data sources by field.
Easy insight creation and management.
Seamlessly navigate to all your analytics tools using the Analytics and Reporting Hub—your one-stop shop for all reports, dashboards, tasks, and admin tools.
“Across our entire organization, we have access to consistent, real-time data. So whether you’re a manager in Milwaukee or Montreal or Dublin, you have access to your own information as well as insights for your team.”
Take immediate action.
Find information quickly.
Give your people easy access to the information they care about via employee profiles, home pages, and drive.
Embed critical insights.
Provide rich decision-making context directly in business processes and custom applications across Workday.
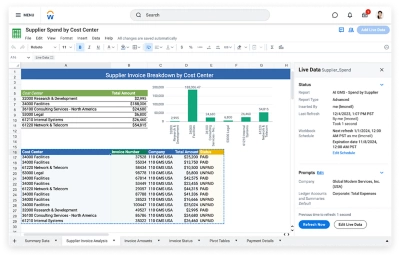
Collaborate with confidence.
Bring insights directly into worksheets in Workday for a familiar spreadsheet experience—all while keeping your data secure.
Financial insights that add value.
Fuel data-driven action across our entire ecosystem of solutions with financial analytics and reporting.
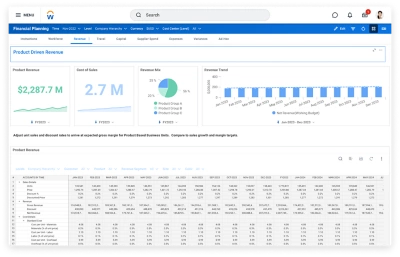
Uncover rich financial data.
Convert revenue and expense data into detailed accounting with Workday Accounting Center and Workday Prism Analytics.
Connect to Microsoft® Excel.
Create reports in Microsoft® Excel and drill from summary data to details in real time with Workday Office Connect.
See how we help you succeed.